Prepare for Impact! (Who gets some?)

T-RO

Well-Known Member
Messages
15,130
Reaction score
16,901
We had a bit of a tangent in the Romo thread, so I split the discussion off here.

The question is: From a positional standpoint...who dictates success, and how much control do they actually have?

I will post two graphs. I invite your questions, disagreement or howls of contempt. ;) Hit me back with something, you lurkers!

Here's the first one:
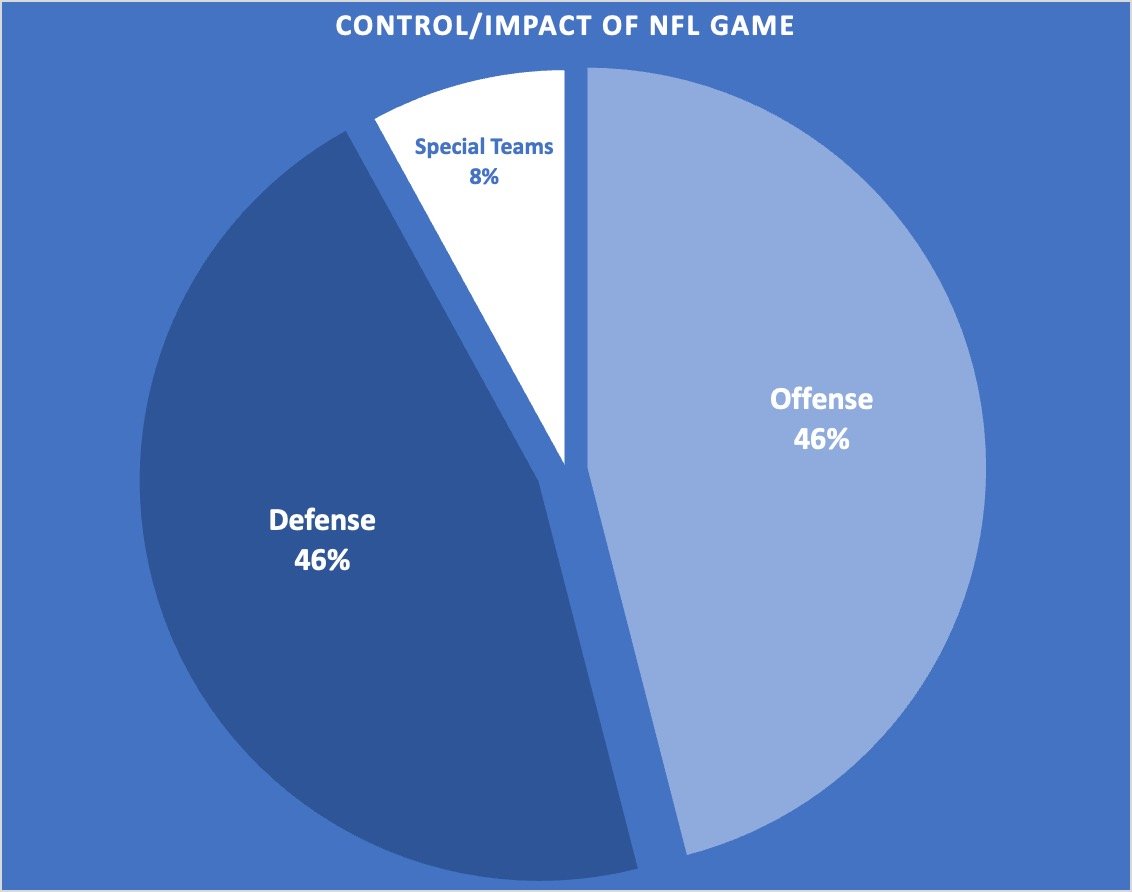

playerControl_BigPicture.jpg
 
Last edited:
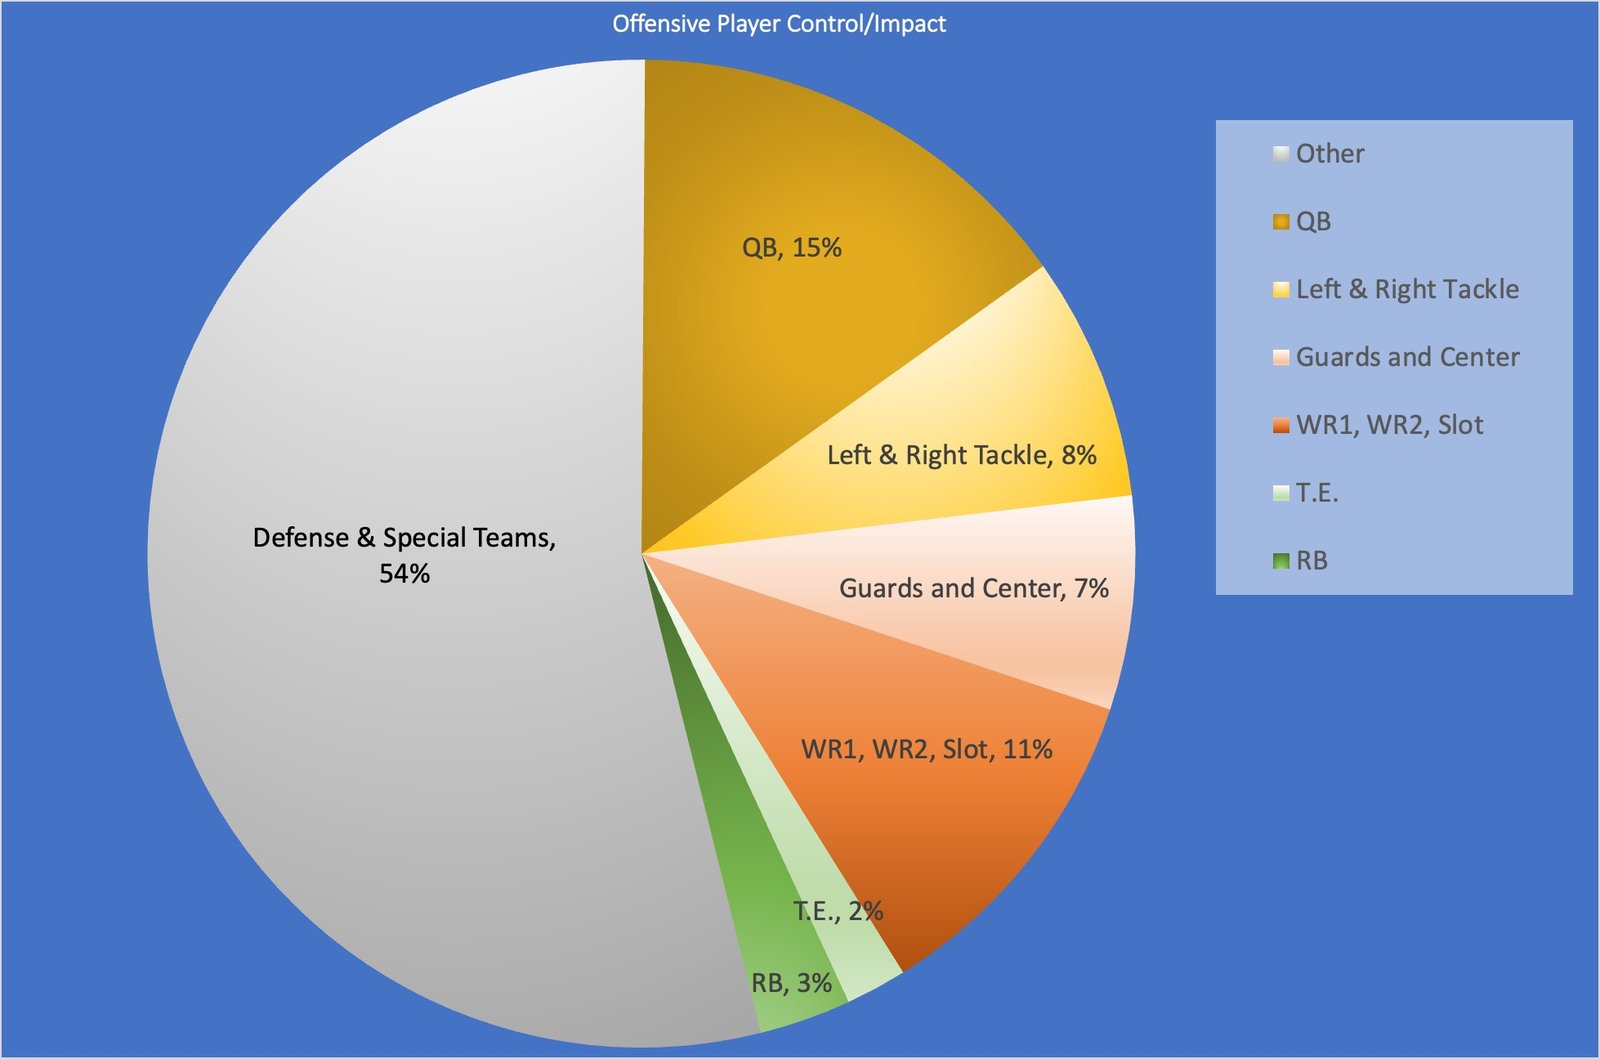
This second graph builds upon the first and expands details about offense.

These are my estimations, though I could see prioritizing it differently. Am I shafting the trenches? Running Back? QB?


playerControl_Offense.jpg
 
Sounds good, but one could say the space in between all 3 sections could be labeled the coaching staff. ;)

Very good point. This first round will focus on players only. Coaching impact would be interesting to guesstimate. As would the impact of wild zebras interfering with their precious flags and whistles. ;-)
 
Sounds good, but one could say the space in between all 3 sections could be labeled the coaching staff. ;)
I will get cute and say the space in the graph is the refs!

Score as quick as possible on any given drive with chunk plays. Don't grind out a 15 play drive as you just know the refs will find a way to throw a flag eventually and you are in 1st and 20 drive over.

So my answer for O......score fast. My answer for D, get the refs to throw for a holding call on their O.
 
I think QB at 15% is way too low.....and so does the league based on their salaries.

If only 15%, then several teams would pay peanuts at QB and load up on other positions with that cap space but everyone knows that doesn't work in 2023.

I reckon QB accounts for half of all O and the pie can be split between the other positions however you like.
 
I'd say the % are team specific. For example, KC play through Kelse so you could have TE at 10% for them.

Bengals are all about WRs etc.

It's a good thought provoking thread though and a change from "I hate Dak" 25 threads a day so thank you!
 
I think QB at 15% is way too low.....and so does the league based on their salaries.

I agree that It's informative to look at salaries.

-Dak's current contract averages $40 million.
-Cowboys team salary obligations are 224 million.

Cowboys QB is getting 18% of the pie.

But if you want to add to QB...you gotta subtract somewhere else. Where would you subtract, Scottishcowboy?
 
I agree that It's informative to look at salaries.

-Dak's current contract averages $40 million.
-Cowboys team salary obligations are 224 million.

Cowboys QB is getting 18% of the pie.

But if you want to add to QB...you gotta subtract somewhere else. Where would you subtract, Scottishcowboy?
I feel a few teams have gone cheap on the O line recently and done OK.

Personally I'd stay cheap on TE and RB by making them rookie deals and move on come 2nd contract.
 
I feel a few teams have gone cheap on the O line recently and done OK.

I vaguely remember a reference to such teams, but can't think of any. Bengals tried it, and they quickly learned they need to invest. Seems like most all the top teams have at least one $14-24 million tackle.

I don't want to swerve into making this thread too much about contractual money, though it certainly relates.

Want to focus on impact.

Isn't it weird that I set the impact of running backs on football success at 3%...and no one (so far) thinks that's strange? (NFL dinosaur thinking is fading)
 
Last edited:
QB only 15%? I'd easily double that if not more. It's the most important position in professional sports.
You are the winner for the day. You get your own data chart! OK...maybe not as exciting as a Starbucks Venti Latte. But I'll create one as you asked, and even let you revise it after you see version 1.

You wanted more than double QB impact. I'll build a graph with 32% Quarterback Impact. I trust you'll stay and help me revise it to your wishes, and we can learn together?
 
Last edited:
If I was casually thinking about it a month ago, I might well have said a QB's impact is 30+ percent of the team, as others have suggested. I'm absolutely not trying to belittle anyone. Just hoping we can explore and learn.
 
This second graph builds upon the first and expands details about offense.

These are my estimations, though I could see prioritizing it differently. Am I shafting the trenches? Running Back? QB?


playerControl_Offense.jpg
Hey, no-one said they'd be grafts on this test!!!!

Hope you grading on a curve... ;)
 
I vaguely remember a reference to such teams, but can't think of any. Bengals tried it, and they quickly learned they need to invest. Seems like most all the top teams have at least one $14-24 million tackle.

I don't want to swerve into making this thread too much about contractual money, though it certainly relates.

Want to focus on impact.

Isn't it weird that I set the impact of running backs on football success at 3%...and no one (so far) thinks that's strange? (NFL dinosaur thinking is fading)
Bengals got to the SB with zero line. KC the same.

Point is fair though and both tries to retool.
 
Hey, no-one said they'd be grafts on this test!!!!

Hope you grading on a curve... ;)
I sure don't have the answers myself! I have started to think about it some.

Nerds like me don't much watch tv or movies. We prefer staring at the wall and thinking...somehow it seems pleasurable. I'm in that class of wierdo.
 
Perhaps why Romo teams never made it to the SB because they didn't have the kind of defense to overcome all the critical turnovers that Romo created.

On this teams, the defense mattered more.
 
Oh, let us see.....how about ..... The REFS ....

Coaches and the game plans, but the players still need to execute the plays.

With the QB touching the ball for every offensive snap. Unless a wildcat type play. Most of the % is on him for that side of the ball, if you break out the grouping by position.
 
We had a bit of a tangent in the Romo thread, so I split the discussion off here.

The question is: From a positional standpoint...who dictates success, and how much control do they actually have?

I will post two graphs. I invite your questions, disagreement or howls of contempt. ;) Hit me back with something, you lurkers!

Here's the first one:


playerControl_BigPicture.jpg
Wondering if the devaluation due to recent rule change regarding fair catch translates to a mass exodus for most teams cap investments for top returners as well as roster spots for teams overall.
Smart teams might consider taking advantage of this scenario and stock up on teams if this scenario were to indeed playout and may alter that graph a tad.
 
Offensive line 30%
Front 7 30%
Quarterback 30%
Coaching 10%

But it’s a trap. Secret force behind all of them - the GM. Drafting, signing and hiring. All these guys started with his blessing.
 

Forum statistics

Threads
464,633
Messages
13,823,358
Members
23,781
Latest member
Vloh10
Back
Top