Prepare for Impact! (Who gets some?)

CowboyRoy

Well-Known Member
Messages
57,924
Reaction score
38,930
We had a bit of a tangent in the Romo thread, so I split the discussion off here.

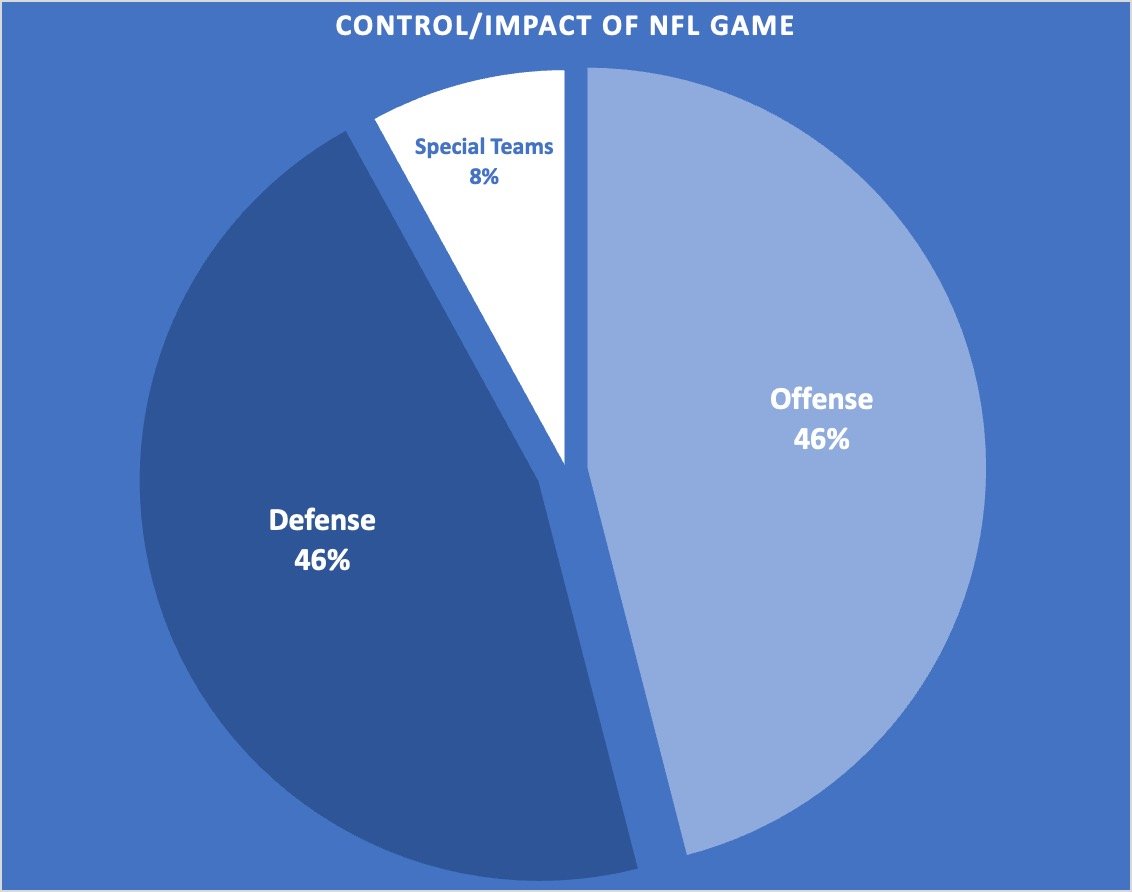
The question is: From a positional standpoint...who dictates success, and how much control do they actually have?

I will post two graphs. I invite your questions, disagreement or howls of contempt. ;) Hit me back with something, you lurkers!

Here's the first one:

playerControl_BigPicture.jpg
Where is the head coach percentage?
 

CowboyRoy

Well-Known Member
Messages
57,924
Reaction score
38,930
I feel a few teams have gone cheap on the O line recently and done OK.

Personally I'd stay cheap on TE and RB by making them rookie deals and move on come 2nd contract.
Coaching 15%
QB 20%
Defense 38%
Oline 15%

Those are the big ones that matter the most.

You can break up the last 12% any way you want.

WR and TE 7%, RB 3%, ST 2%?

Thats how I would break it up.
 

tyke1doe

Well-Known Member
Messages
54,363
Reaction score
32,748
Great work and great topic!
However, the initial problem I see with the chart (assuming I'm understanding it correctly) is that it's never static. There are always variables of imbalance.
For example, at any given time, a team can have an offense that is 80 percent, a defense that is 15 percent and a coach or coaching that is 5 percent (See Dan Marino's Dolphins).
Or an offense that is 50 percent, a defense that is 48 percent and coaching that is 2 percent (See the Cowboys last Super Bowl team with Switzer for example).
Or an offense that is 70 percent, a defense that is 10 percent and a coach that is 20 percent (See the Reeves-Elway Broncos).
I suspect with the Super Bowl champion Ravens, Buccaneers and Bears, the statistical break down would be 90 percent defense.
The percentage of impact corresponds with the type of team, the players/talent, the scheme and the coaching.
 

Pass2Run

Well-Known Member
Messages
10,870
Reaction score
12,221
We had a bit of a tangent in the Romo thread, so I split the discussion off here.

The question is: From a positional standpoint...who dictates success, and how much control do they actually have?

I will post two graphs. I invite your questions, disagreement or howls of contempt. ;) Hit me back with something, you lurkers!

Here's the first one:


playerControl_BigPicture.jpg
Lol, another threAd?

Someone please hire TR-O so he stops posting advertisements.

Can't you all see he can help your business?
 

CCBoy

Well-Known Member
Messages
47,603
Reaction score
22,927
Lol, another threAd?

Someone please hire TR-O so he stops posting advertisements.

Can't you all see he can help your business?
Ironic humor right? Naw...on site another business can not be conducted. You scheming here?
 

T-RO

Well-Known Member
Messages
15,089
Reaction score
16,861
Offensive line 30%
Front 7 30%
Quarterback 30%
Coaching 10%

But it’s a trap. Secret force behind all of them - the GM. Drafting, signing and hiring. All these guys started with his blessing.
Receivers and cornerbacks are among the highest paid player in the sport. They have 0% impact? 0% impact for running backs? 0% for special teams?
 

T-RO

Well-Known Member
Messages
15,089
Reaction score
16,861
Anything you can do, AI can do better...

:D

:laugh:
Most anything. And soon it'll do everything way better than we humans.

No doubt about that. I usually use Excel or FileMaker for graphs now...tomorrow, who nows?
 

T-RO

Well-Known Member
Messages
15,089
Reaction score
16,861
You can take win shares and do this instead of just making up numbers.
My numbers are loosely based on:
-Snap count
-Salary distribution
-Immediacy of ability to score, or assist in a score

But I think we all would like to know more about "win shares".
 

eromeopolk

Well-Known Member
Messages
4,792
Reaction score
4,555
We had a bit of a tangent in the Romo thread, so I split the discussion off here.

The question is: From a positional standpoint...who dictates success, and how much control do they actually have?

I will post two graphs. I invite your questions, disagreement or howls of contempt. ;) Hit me back with something, you lurkers!

Here's the first one:


playerControl_BigPicture.jpg
You pass to score, run to win, and defense wins championships. See the Dallas Cowboys from 1960-1995. As long as you got a very good special teams/kicking coach you got special teams.

You have to win 2 of the three phases to win a game which are offense, defense, and special teams. So the pie chart should be 33 1/3 to each phase with the remainder to the defense. This is football game fact.

A wise NFL executive told me every football game is decided by 3 or 4 impact plays/play calls. He told me go look at the Super Bowl. KC had 3 impact plays/play calls and a one legged QB won a Super Bowl...again.
 

DFWJC

Well-Known Member
Messages
60,148
Reaction score
48,930
CowboysZone LOYAL Fan
I think QB at 15% is way too low.....and so does the league based on their salaries.

If only 15%, then several teams would pay peanuts at QB and load up on other positions with that cap space but everyone knows that doesn't work in 2023.

I reckon QB accounts for half of all O and the pie can be split between the other positions however you like.
So, on that graph that would be 23% to QB

I think the highest salaries usually come in at 15-20% max and most are lower.

Either way, I'd give the offense more than 46% of the total in today's NFL.
Offense and defense are no longer equal in value....imo
 

T-RO

Well-Known Member
Messages
15,089
Reaction score
16,861
Thanks, Fuzzy....that does certainly relate to our discussion.

Sounds like the analytics team at ESPN is borrowing existing concepts like WAR (a player's Wins Added Above Replacement) or Pro Football References's "Approximate Value" .

Trying initially to just to set the table for the full family, but happy to discuss as we move along.
 

CowboysLakerBamaFan

Well-Known Member
Messages
5,229
Reaction score
4,148
I think QB at 15% is way too low.....and so does the league based on their salaries.

If only 15%, then several teams would pay peanuts at QB and load up on other positions with that cap space but everyone knows that doesn't work in 2023.

I reckon QB accounts for half of all O and the pie can be split between the other positions however you like.
I agree with u and would push it even farther. Can anyone really think of a great QB in the modern era...whose team sucked?

You can find teams with great WRs or RBs or DEnds or corners....even HOF guys at those positions, aying on bad teams... but if you show me a top 5 QB, then his team is in the playoffs, even moreso in the last 10 years or so.

I'd be willing to stretch that to 40 or even 50% for QB alone. It's that important....and has that much trickle down effect on all other units including defense.

The Ravens won a SB with an average QB in 2000 with an all time great defense, but rules were different then. As a GREAT example, our arch rival Eagles had one of the top 5 greatest defenses of all time in 1991, with Reggie White in his prime. #1 against Pass, #1 against run, #1 overall Defense, with a HOFer and 7 or 8 probowlers just on defense. But they had to play with a bad QB that year, and couldn't even make a wildcard game, because they lost a zillion games 10 to 9.

You have a Top 5 all time QB, I don't care how bad ur defense or special teams are, ur making the playoffs and will probably win at least 1 SB in his career
 
Top