Philmonroe
Well-Known Member
- Messages
- 6,698
- Reaction score
- 5,095
If that makes you feel less insecure yes that's it. Feel less insecure now?And here you are again. Another empty contribution. Well done. You just can't get enough of me, can ya?
If that makes you feel less insecure yes that's it. Feel less insecure now?And here you are again. Another empty contribution. Well done. You just can't get enough of me, can ya?
Make me dsfShut up already. Sheesh
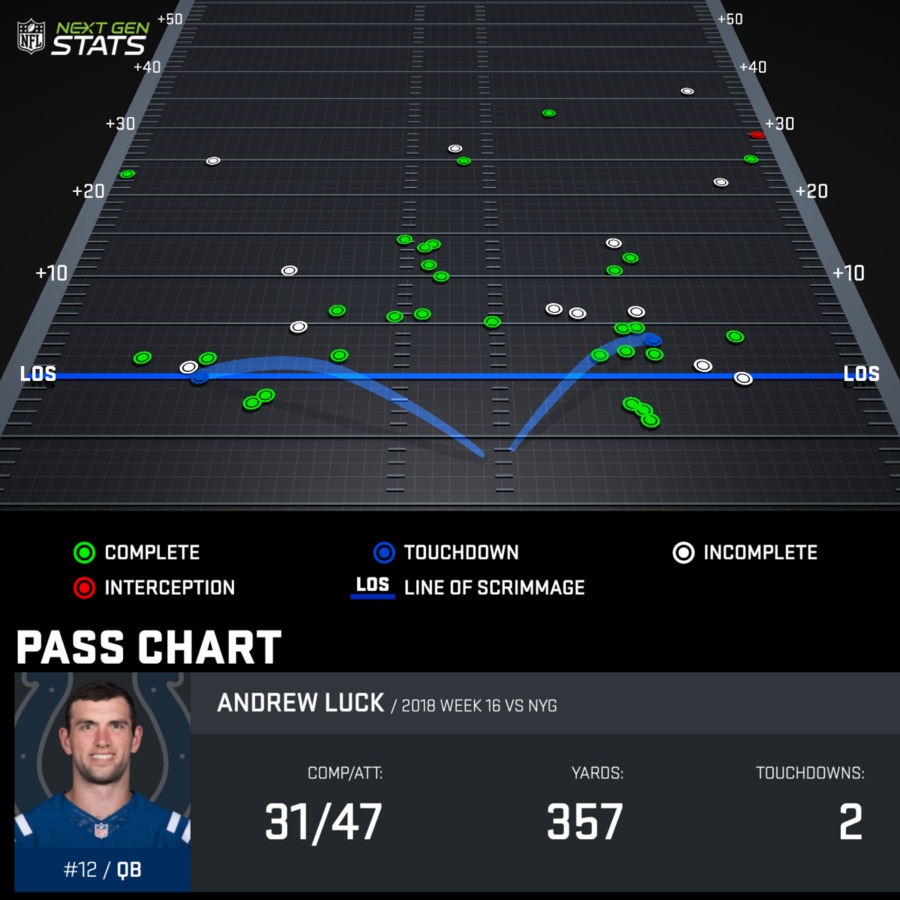
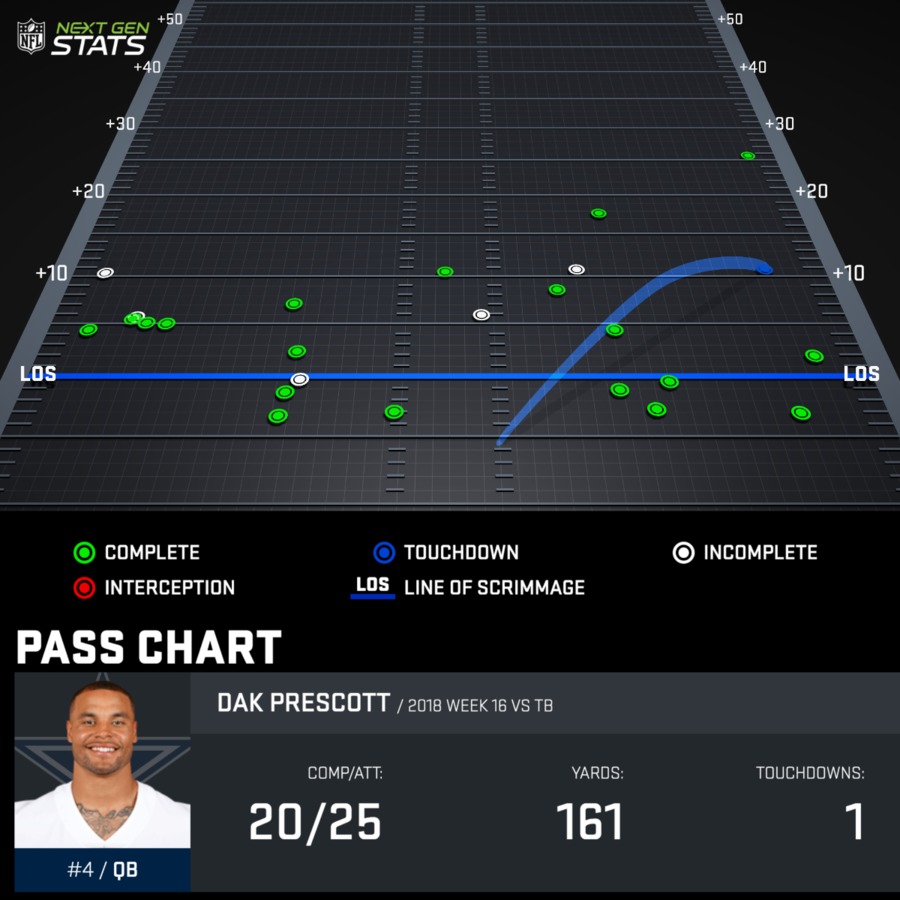
5 passes attempted past 10 yards, 3 completed.
Say it. Be a man.Make me dsf
This is more of a scheme issue than a player issue, if you want to attack someone linehan
Say what we are all typing nsg. I'm always a man nothing can change that. Use better logic.Say it. Be a man.
Thanks for posting this. The more info that is posted, the more the truth will be revealed5 passes attempted past 10 yards, 3 completed.
https://cowboyszone.com/threads/the-quarterback-accuracy-game.424562/This is cutting edge stuff!
This forum is like watching the movie "Groundhog's day"
Nothing new or inventive, just the same nonsense thrown up over and over.
Quoted part is the difference between 2015 and 2016, simple as that.With the addition of Zeke
5 passes attempted past 10 yards, 3 completed.
50 pass attempts for 300 pass yards?
2/3 rds of his passes were 5 yards or less.
Which is a pretty good point. Dak is conservative in protecting the ball. That's not the worst thing in the world, especially when you've got a good defense.Let's face it, he just didn't pass much in a game we won.
5 passes attempted past 10 yards, 3 completed.
It's an OL issue.
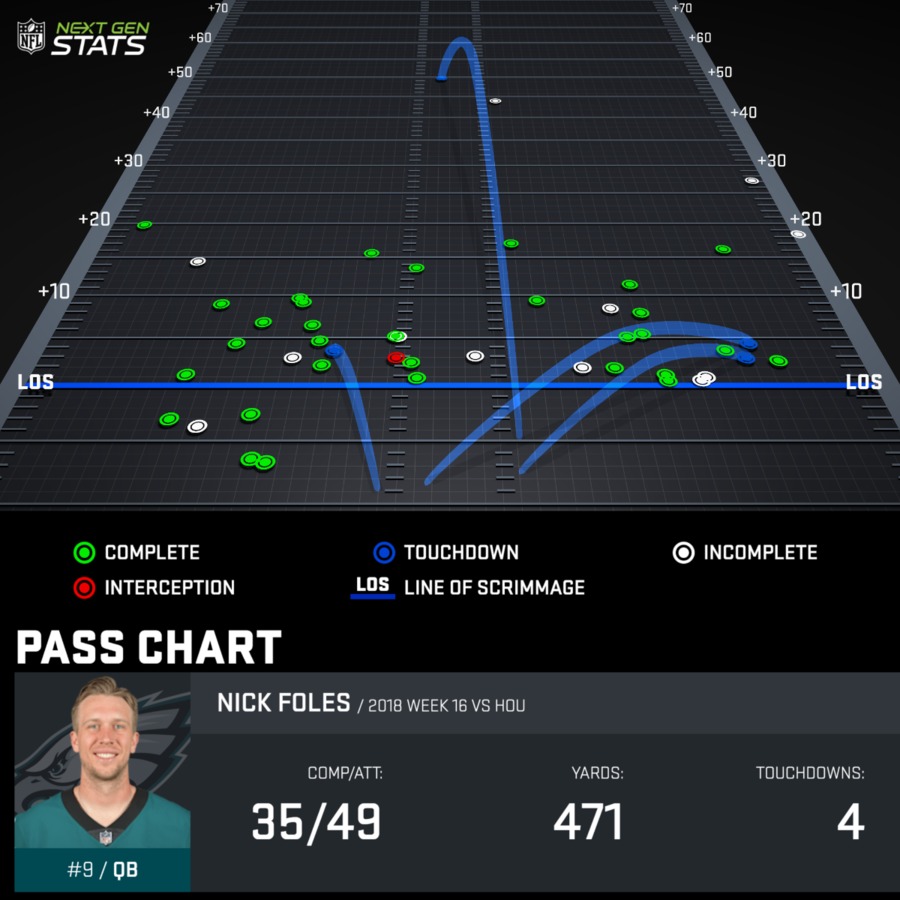
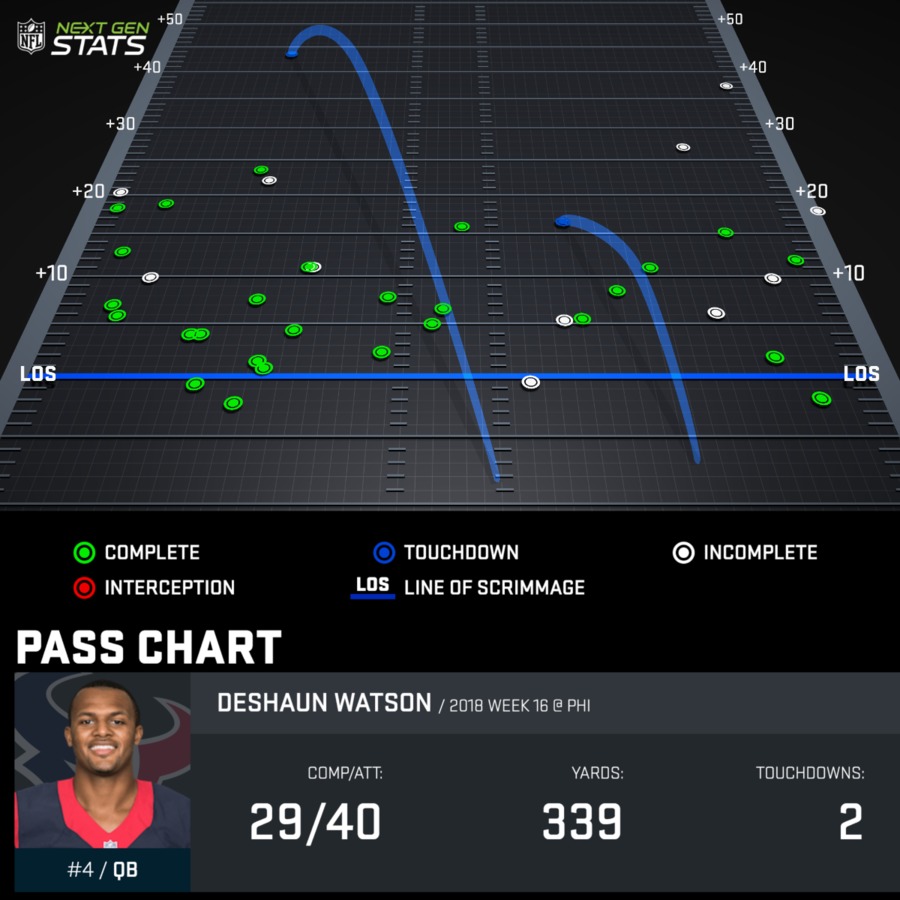
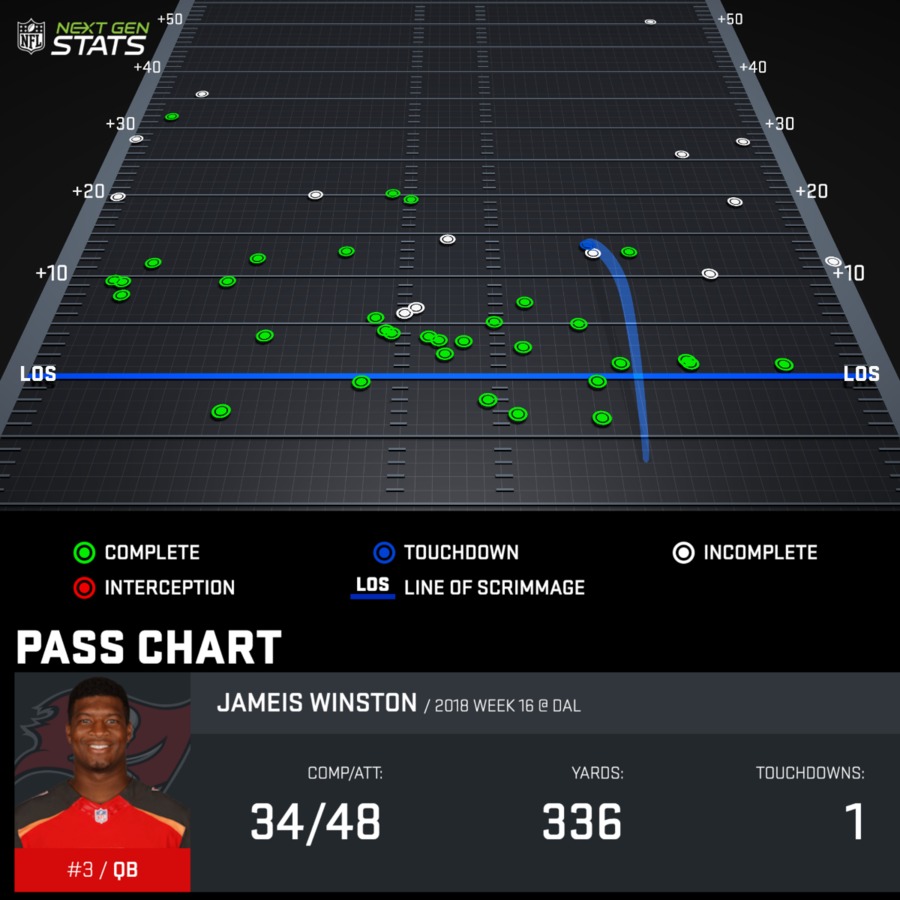
Compare:
None of these guys play in a run first offense. None of them. This comparison stuff is corny.